July PPI Up 0.1%, Below 0.2% Forecast

A Sector-by-Sector Breakdown: Winners and Losers
Goods: The Unexpected Frontrunner
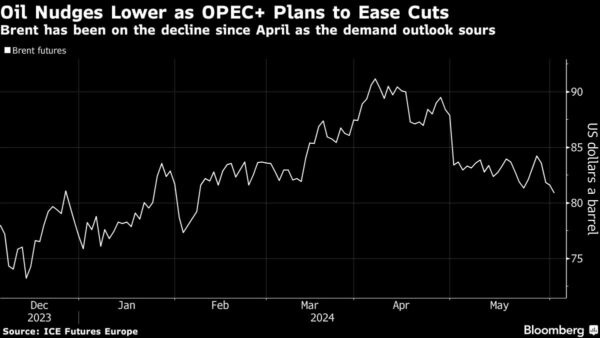
Final demand goods prices surged 0.6%, marking the largest increase since February. This rise was primarily fueled by a substantial 1.9% jump in energy prices. Gasoline led the charge with a 2.8% advance, while diesel fuel, meats, and jet fuel also saw significant increases.
Services: A Surprising Retreat
In contrast to the goods sector, final demand services prices dipped 0.2%, the most substantial decrease since March 2023. This decline was largely attributed to a 1.3% drop in final demand trade services, reflecting changes in margins received by wholesalers and retailers.
The Long View: Annual Inflation Trends
On a year-over-year basis, the unadjusted index for final demand climbed 2.2%. More tellingly, the index for final demand less foods, energy, and trade services rose 3.3% over the same period, signaling persistent underlying inflation pressures.
Reading Between the Lines: What It All Means
While the headline PPI figure came in slightly below estimates, the report reveals a complex picture of inflationary pressures. Energy and goods prices showed significant increases, counterbalanced by declining services prices. The higher-than-previous-month increase in core prices suggests that inflationary concerns remain valid, despite the lower-than-expected headline figure.
This detailed report underscores the complexity of the current economic environment and the challenges in accurately forecasting inflation trends. As we move through these economic conditions, the PPI continues to serve as a crucial barometer of wholesale inflation, offering valuable insights into the broader economic picture.
This article was originally published by a www.fxempire.com
Read it HERE