The Fed’s Preferred Inflation Measure, PCE, Shows No Further Progress – MishTalk
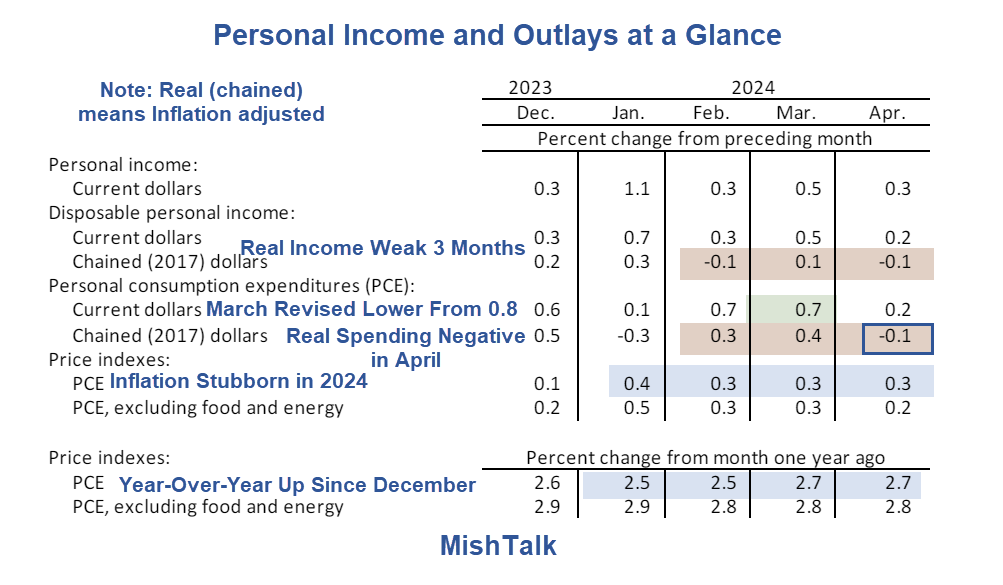
More weakening: Real (inflation-adjusted) Income and spending was negative in April. The PCE price index remained flat at 0.3 percent for the month and 2.7 percent for the year. Chart from the BEA, annotations by Mish
Personal Income and Outlays, April 2024
The BEA’s Personal Income and Outlays report for April shows no further progress on the inflation front and weakening consumer spending.
PCE stands for Personal Consumption Expenditures. The PCE price index is the Fed’s preferred measure of inflation.
Key Income and Outlays Details
Real Income was negative for two out of the last three months and barely positive in March.
Real spending was negative in April as consumers threw in the towel.
The PCE price index has been stubbornly high all year, up at least 0.3 percent every month.
The year-over-year price index is higher than it was four months ago.
Personal Income and Real Personal Income
Personal income increased $65.3 billion (0.3 percent at a monthly rate) in April
Disposable personal income (DPI) —personal income less personal current taxes—increased $40.2 billion (0.2 percent)
Real DPI decreased 0.1 percent in April and real PCE decreased 0.1 percent; goods decreased 0.4 percent and services increased 0.1 percent.
Real PCE and Real PCE Details
Personal consumption expenditures (PCE) increased $39.1 billion (0.2 percent).
The 0.1 percent decrease in real PCE in April reflected a decrease of 0.4 percent in spending on goods and an increase of 0.1 percent in spending on services.
Within goods, the largest contributors to the decrease were gasoline and other energy goods (led by motor vehicle fuels, lubricants, and fluids), recreational goods and vehicles (led by information processing equipment), and other nondurable goods (led by recreational items).
Within services, the largest contributor to the increase was health care (led by outpatient services).
I will have additional charts shortly. The lead chart tells the story at a glance.
More Soft Economic Data, Q1 GDP Revised Lower, Q4 GDI Significantly Lower
GDP and GDI data from BEA, chart by Mish
Yesterday I commented More Soft Economic Data, Q1 GDP Revised Lower, Q4 GDI Significantly Lower
The economic slowdown continues led by income and consumer spending.
The same story repeats in April.
This article was originally published by a mishtalk.com
Read it HERE